


In the wake of the 2015 election result, the media has quickly thrown pollsters under the bus for getting it wrong. Indeed, some pollsters have jumped off the curb with no help at all from their friends in the press.
Polls consistently suggested the Conservatives and Labour were neck and neck, so when the former came away with a majority large enough to govern alone, the critics had a field day – even though every mention of the election in the media before polling day had begun with the opening phrase “it’s the most unpredictable election in years”.
Not to be outdone, the British Polling Council has commissioned a special inquiry into the causes of the alleged debacle.
But we believe the criticisms, mea culpas and rush to judgement are misdirected. Polling is not the same as predicting – especially not under the electoral system that operates in the UK.
The trouble with polling
There are two fundamental points to keep in mind in the wake of this election. First, polls provide raw material for forecasts – they do not seek to predict the outcome of an election. Second, national-level vote share forecasts may be very poor guides to the number of seats parties are actually likely to win, especially when votes are tallied in a first-past-the-post electoral system with widely varying patterns of constituency-level competition.
If you want to use vote intention numbers in polls to estimate popular vote shares, you have to take into account whether or not people will actually vote. One of the reasons why the exit poll was so accurate in this election is that we can be sure the people surveyed definitely voted, because they were leaving the polling station when they were interviewed. When you ask them before polling day, you can’t tell for certain they will show up on the day.
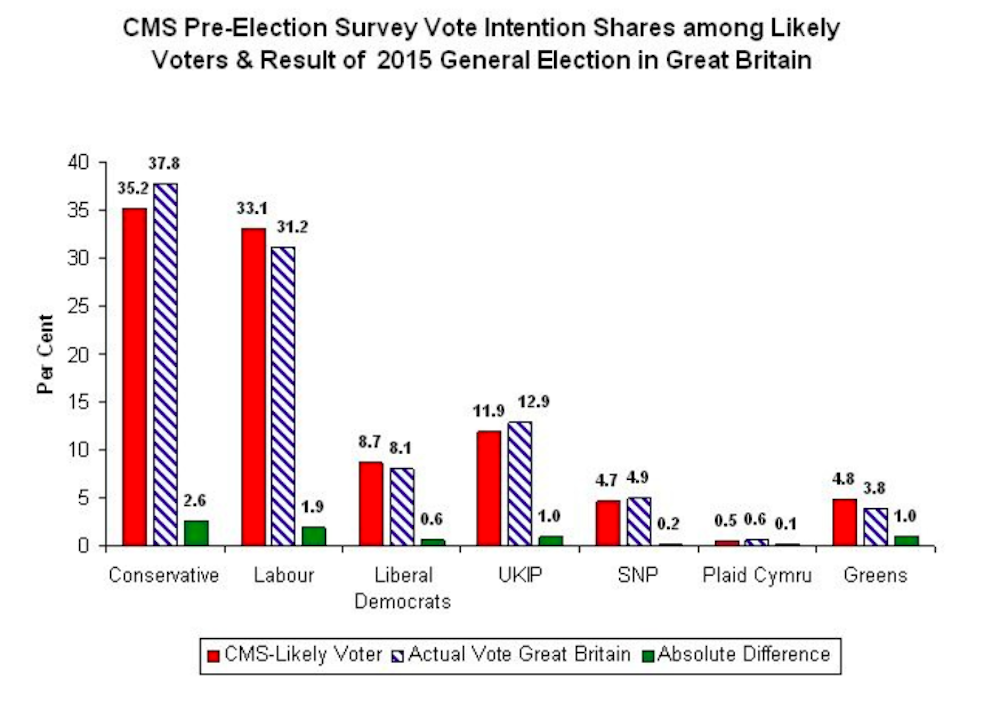
With a survey conducted before the election, the numbers should be filtered by the likelihood that survey respondents actually will vote. The graph below illustrates the point. Using data from the Essex Continuous Monitoring Survey, conducted in the third week of April 2015, we use an 11-point likelihood of voting scale. Respondents who are very unlikely to vote rate themselves zero and those very likely to vote ten. We then combine that rating with information about whether they voted in the 2010 general election to select the likely voters.
For first-time eligible voters, we use a well-researched measure – whether they consider voting to be a civic duty – if they strongly agree with this it means they are more likely to vote. The resulting adjusted vote shares deviate from the parties’ actual vote shares (in Great Britain) by less than 1% on average.
A second important point is that a survey’s reported vote intentions are based on samples and as such they are subject to sampling errors, which makes them necessarily uncertain. This means that the samples do not precisely reproduce the characteristics of voters in general – just by chance there are perhaps too many middle-aged men or not enough young people in the sample.
So we construct what are called confidence intervals around the vote intention figures. These are measures of how uncertain we are about the figures, and allow us to say things like: “there is a 95% chance that the Labour vote will vary from 29% to 33%”. These tend to get forgotten when the polls are reported, but they should be both calculated and heeded. This also means that if the pollsters do everything right, then by chance they are going to get it wrong about one out of every 20 elections.
Our April survey data shows that all estimated vote shares, with the exception of the Conservatives, are not significantly different from the parties’ actual vote totals. That means the difference between the survey outcome and the actual vote is due to chance, and not to any systematic difference between the two measures. In the Conservative case, the survey number is only .04% outside the confidence band, which means it is an unusual but not really a rogue figure.
Keeping sampling error in mind and developing well-validated likely voter filters will improve the use of survey data for forecasting popular vote totals.
The first-past-the-post problem
Those who insist on using survey data to forecast election outcomes will need to go further, since elections in Britain are decided by the number of seats won rather than by the actual number of votes. Polls could show one party getting significantly more support but that doesn’t necessarily mean they will secure the most seats. The party that won the most votes did not win the most seats in the elections of 1929, 1951 and February 1974.
Even with appropriate adjustments, national vote intention percentages from surveys are likely to be insufficient in an era of voter volatility and multi-party competition. When the voters have more choice or they think that their preferred party has no chance in their constituency they may very well change their vote. This happens more now that loyalty towards the top two parties is weaker.
In the run-up to the 2015 election, Lord Ashcroft tried to address the problem by conducting a large number (nearly 170!) constituency polls. Since some of these were conducted nearly a year before the election, there was a risk of missing possible changes in voter intentions in various constituencies. Moreover, constituency-level polls (like their national counterparts) need to correct for the likelihood of people voting – and as always, sampling errors make predictions of close races a hazardous enterprise, because the confidence intervals overlap.
Can we fix it?
Although we could imagine building on the Ashcroft approach, it is very expensive and expanding it is not a realistic option. Developing new, less expensive election forecasting tools that make better use of the kinds of survey data that are likely to be available should be a top priority.
One approach, advocated by economists, is to jettison polls entirely and use betting markets. We are sceptical about this – the final Ladbrokes numbers were just as far off the mark as the polls, putting the Conservatives on 286 seats, Labour on 267 and the Liberal Democrats on 26. These figures are not surprising; after all, many punters search the media for forecasts based on polling data to help them decide how to place their bets.
Other forecasting methods, using trends in unemployment, interest rates, housing prices and other variables also have their advocates. We are confident that economic conditions affect electoral choice, but decades of research indicate that models translating trends in economic sentiments into election outcomes frequently fail to perform as advertised.
Ultimately, the media, voters and pollsters alike would do well to recognise the distinction between polls and forecasts. Raw poll numbers are not adequate for forecasting parties’ vote shares, let alone their seat totals.
Polls are most useful for providing information about the attitudes and reported behaviour of people. With large sample sizes and well-validated likely voter filters, high quality pre and post-election polls can tell us a lot about the who and why of electoral choice and what parties’ popular vote totals are likely to be on election day. If the filters to identify who actually votes were better, then the polls would have been more accurate.
Such polls also provide valuable inputs for seat-share forecasting models. But they are not substitutes for such models. The latter are still in the development stage. A lot of interesting work has been done and more remains. But for the moment we shouldn’t automatically assume that the polls were wrong – even if the election result took many people by surprise.